How to Trade in Forex by Candlesticks Pattern Analysis
Last Update: 12 November,2014At first we should know what is technical analysis?
Technical analysis is the practical price action that may help you to make a buy and sell decision. Most technical analysis are done using charts with different pattern and chart bar. So technical analysis are sometimes called chartist. Fundamental analysis ( market economic analysis) are always basis of technical analysis hence fundamental analysis always scorn from technical analysis. So it may be said that technical analysis is more important than fundamental analysis.
Why we should use candlesticks pattern:
Without any doubt we know that candlesticks pattern is the most popular chart pattern among bar charts and line charts and 90%-95% trader use it for their easy technical analysis .Most of the time market move based price action and to understand it candlesticks chart patterns are very vital.
From candle sticks pattern we can get “pinbar” which is most relevant pattern that help to understand the market movement easily. Basically if pinbar reject important price movement level then market move in inverse direction. But it is not right that every pinbar will work 100%! so we need to understand the correct and suitable pinbar to be mastered in forex .
Here I am going to discuss most important candlesticks pattern which help you to understand the price action strategy of the market properly and to make right trading decision.
Basic Bullish and bearish Candlesticks Patterns:
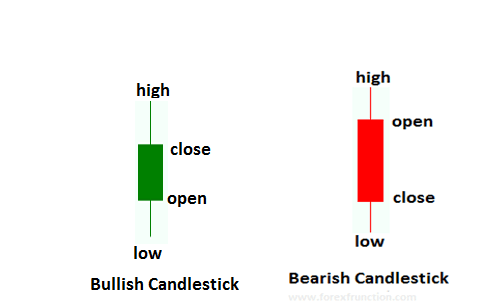
Here you see bullish and bearish candlesticks chart pattern. In where bullish chart patterns opened at lower and closed at higher that means buyer are coming . For the bearish candlesticks pattern is open at higher and closed at lower which means sellers are coming.
Basic bullish and bearish Candlesticks pattern’s pinbar:
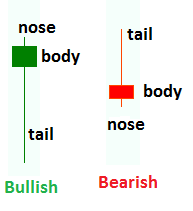
i) The bullish pinbar refers that the market should be bullish because its body in the upper side and tail in the lower side.
ii) For bearish pinbar give the region to be downtrend and here sellers are coming with more energy which is indicated as the tail are upper level and body is the lower level.
Different Types of candlesticks pattern study :
The name of the candlesticks patterns are come from interesting words and I am going to describe these with easy language and shortly.
# Hammer:
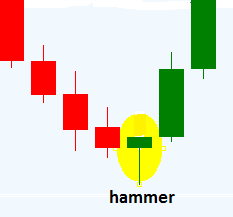
i)This pinbar give bullish signal of the market price and it comes after a long down trend.
ii) The range of closing and opening price is small and it’s body may be green or red. So when you see this pinbar then you can make a decision for BUY.
In a words it shows that-
<-buyers are comming in .
-buy when price close above high of hammer.
- give stop loss below hammer.
# Hanging Man:
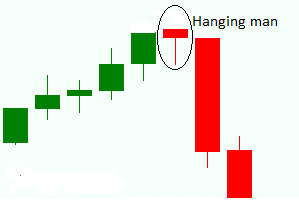
( i) This pinbar is same to the hammer but it comes from after a significant uptrend.
(ii) When hanging man pinbar is found you can make a SELL decision with proper analysis.
##Doji :
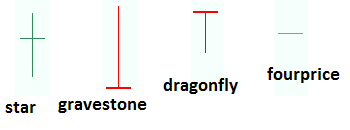
i) The doji comes when price opened and closed at the same position.
ii) There are four kinds of doji candlesticks patterns these are star doji, gravestone doji, dragonfly doji, fourprice doji. These are the most significant pinbar and help to make you correct decision to enter the market.
iii) When doji comes after a significant down trend then you can make a BUY decision and when it comes after a up trend then you can make sell decision.
Shooting Star:
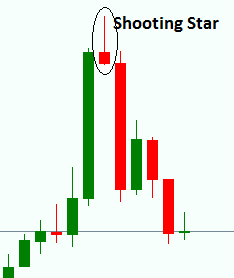
(i)It comes after a long bullish trend these means buyers are going out and sellers are coming.
(ii)You can make a SELL trade when price close below the shooting start candlesticks pattern.
(iii)Put tight stop loss at the above of shooting star.
Morning Star:
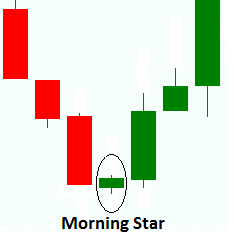
i) It may form after a short down trend. The higher it has low higher shadow and low lower shadow.
ii) The opening and closing price may close . It might be bullish after the bearish candlesticks pattern.
iii) It may help you for opening a BUY trade as buyers are starting to come in the market.
Evening Star:
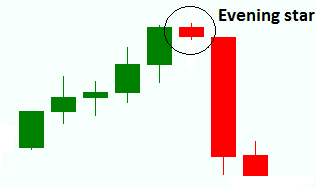
i) Evening star is just opposite to the morning star candlesticks pattern. It means that the buyers are going out from the market and sellers are beginning to enter the market
ii) It is a bearish pinbar so it might help you to make a SELL trade.
Bullish Engulfing:
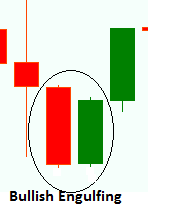
i) Bullish Engulfing comes from the pure downtrend and sellers get trapped as more buyers are coming with more energy.
ii) If may help you to make buy decision if the next candle closed at uppers level compare this bullish candle.
Bearish Engulfing:
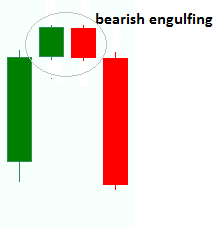
(i)This is another bearish candlesticks pattern and it may opens after a gave pattern.
(ii)If it formed at the resistance level then you can make a decision for SELL.
Dark Cloud Cover:
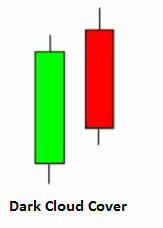
i) After a bullish candlesticks pattern if the red candle or bearish candle opens at higher then bullish candle and end closed at the lower compare of bullish candle than dark cloud cover candlesticks pattern is formed , you can make a decision for SELL.
ii) open make a quick decision for SELL you can wait for the next candle for confirmation.
Harami:
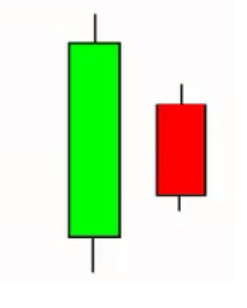
i) When the bearish candlesticks pattern is opened lower compare to the bullish pattern and closed at the upper level then harami or bearish pattern is formed .
ii) This candle can help you for making a SELL decision at the resistance level.
Risk Warning: Don’t make quick decision for opening a sell or buy trade when you see a pinbar or significant candlesticks pattern. You should careful about the fundamental news publishing time, analysis the market with support resistance, pivot point , fibo retracement etc. After all you can make a decision for opening a proper and true trade with managing a stable money management rule.
Submit Your Comments:
FOREX VPS FOR TRADERS
FF FOREX VPS
Windows 2012R2/2016 | Server Location Amsterdam, France, Canada | Low Latency From Brokers| Super Fast Trading Experience | All types of EA supported | 3 Days Money Back Guarantee
| Plan Name | Buy Link | CPU | RAM | Disk | BandWidth | Price (Montly) | Price (Quarterly) | Price (Semi-Annually ) | Price (Annually) | Installation | BackUp | Setup Fee |
| ECO-01 | buy now | 1 Core | 756MB | 18GB | Unmetered | $4.99/M | $4.49/M | $3.99/M | $2.99/M | MT4 Pre-Installed | Yes | Free |
| ECO-02 | buy now | 1 Core | 1GB | 22GB | Unmetered | $5.99/M | $5.49/M | $4.99/M | $3.99/M | MT4 Pre-Installed | Yes | Free |
| ECO-03 | buy now | 2 Core | 2GB | 30GB | Unmetered | $9.99/M | $9.49/M | $8.99/M | $7.99/M | MT4 Pre-Installed | Yes | Free |
| ECO-04 | buy now | 2 Core | 3GB | 32GB | Unmetered | $13.99/M | $13.49/M | $12.99/M | $11.99/M | MT4 Pre-Installed | Yes | Free |
| ECO-05 | buy now | 3 Core | 4GB | 40GB | Unmetered | $17.99/M | $17.49/M | $16.99/M | $15.99/M | MT4 Pre-Installed | Yes | Free |
| ECO-06 | buy now | 3 Core | 5GB | 45GB | Unmetered | $21.99/M | $21.49/M | $20.99/M | $19.99/M | MT4 Pre-Installed | Yes | Free |
***We accept Paypal, Perfect Money, Bitcoin !


