Forex Live Heat Map |
Market Comments |
Technical Indicator Signals |
Cross Pair Rates
| Live Spread
| Live Charts
| Daily Pivot Points
3 Simple yet Highly Effective Candlestick Patterns
Last Update: 18 December,2016Now we know everything about Japanese candlesticks, but still we have to learn as how to trade and benefit from them. In today’s times, candlestick charts is the best technique for analyzing the forex market because not only we get to see a beautiful graphical illustration of the currency pair, but candlesticks are itself an important tool for speculating the future price moment, and this is possible with the help of various different types of candlestick patterns.
What is the Meaning of Candlestick Patterns?
A single candlestick provides the market information as according to the selected timeframe and this information help us in analyzing the current market scenario of a currency pair, but when a series of candlesticks is used for analyzing the currency pair, a trader is able to see a bigger picture of the current market situation, as a result, it becomes easier to speculate the future price movement and make a trading decision.A repeated and combined use of multiple candlesticks for analyzing the market as per every different scenario is known as “Candlestick Pattern Analysis” and also “Candlestick Trading Strategy“ .
Today, we will learn all the top 3 basic, simple yet highly effective candlestick patterns and more advanced candlestick patterns will be learned in the later lessons.
Top 3 Simple and Fundamentally Important Candlestick Patterns
1. Marubozu
Marubozu are the real bodies without any hands and legs i.e. these are the candlesticks with almost 100% real body without any shadows. A marubozu candlestick is a long solid candle, and it is formed when the market shows a strong move in any direction i.e. the candlestick’s opening price is the lowest/highest price and the closing price is the highest/lowest price as according to the trending direction.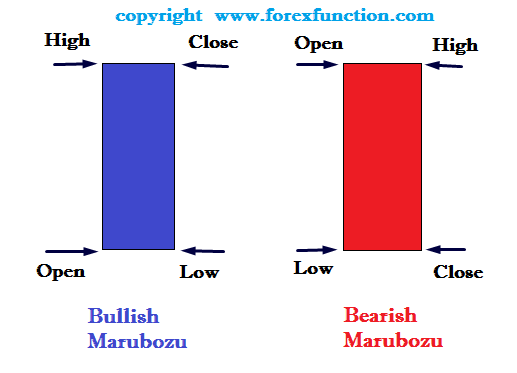
Marubozu Candlestick Pattern
A Bullish Marubozu is a white or green color candlestick with a long real body without any shadows. The opening price is the lowest price, and the closing price is the highest price of the candlestick. A bullish marubozu reflects a great demand in the market resulting into an intense buying pressure even at a continuous increasing price. A bullish marubozu is often seen at the start and/or continuation of a bullish trend and also at times of immediate bullish reversals.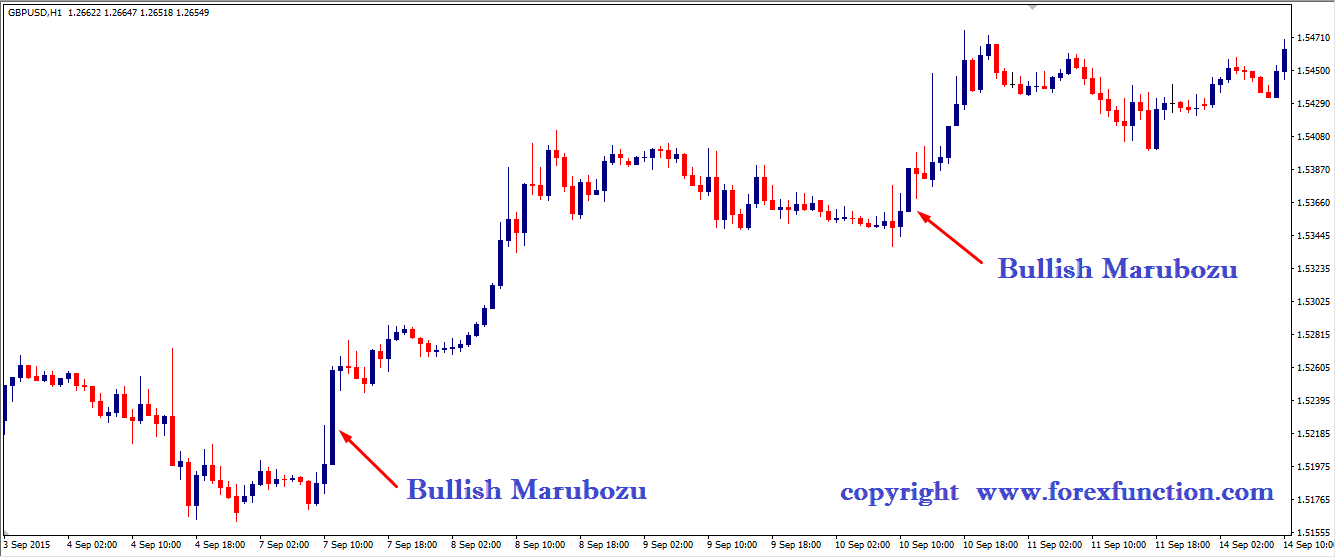
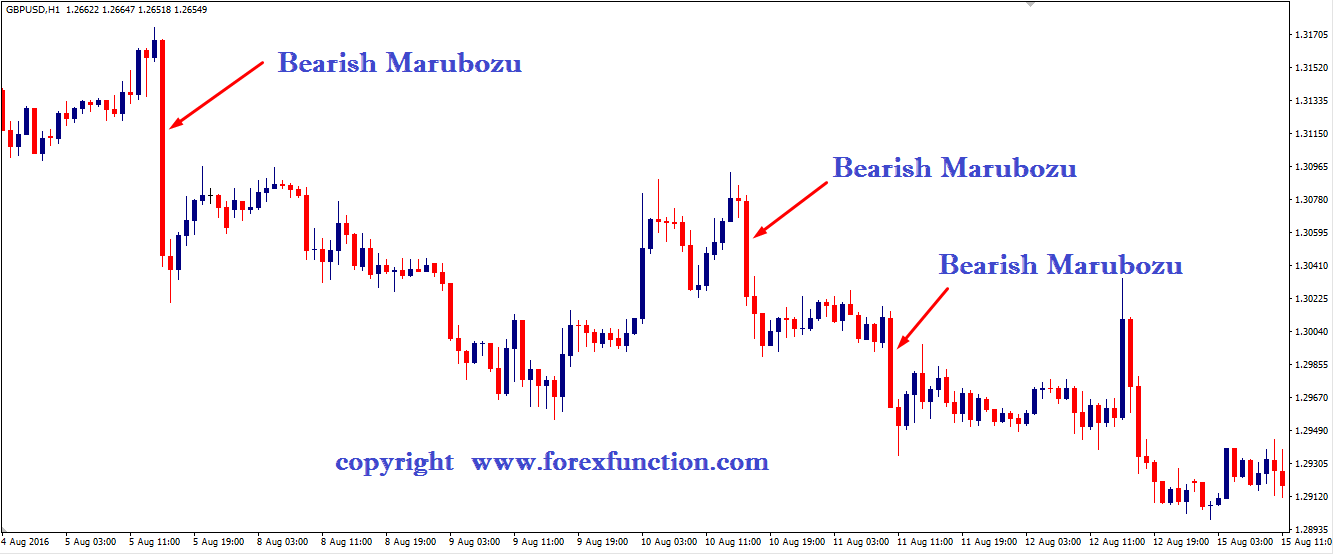
A Bearish Marubozu is a black or red color candlestick with a long real body without any shadows. The opening price is the highest price, and the closing price is the lowest price of the candlestick. A bearish marubozu reflects a great supply in the market at the times of decrease in demand resulting into an intense selling pressure even at a continuous declining price. A bearish marubozu is often seen at the start and/or continuation of a bearish trend and also at times of immediate bearish reversals.
2. Spinning Tops
Yes, you guessed correctly; these are the candles looking similar to the spinning tops by which we used to play many years ago these are the candles which keeps on spinning at the tops and bottoms of the price swings i.e. these are the candlesticks which has a small real body with the upper shadow and a lower shadow.Spinning Tops Candlestick Pattern
A spinning top is formed after the huge fight between the bulls and bears with nobody having the upper hand and finally resulting into a draw i.e. the small real body with the upper and lower shadow reflects the price action information that it was very active and volatile during the day, both bulls and bears had a huge fight for gaining the upper hand but despite all their efforts resulted into a draw by closing near the opening price and leaving the significant highest and lowest traded price action in the form of shadows. The color of spinning tops is not important because any spinning top has a very small real body with the closing price very near to the opening price.Two or more small real body candlesticks having the same high or low at a particular price level are called Tweezers. Whenever tweezers are formed at the peaks or troughs of the price swings, it reflects a high probability that the current trend is losing its momentum and might result into a sideways direction and/or reverse into an opposite direction.
If a spinning top is formed at the demand level, then the probability of the future price movement bouncing back from the demand level increases because a spinning top at a support level means the bears are losing their strength as they are not able to decline price any further resulting into a huge possibility that the price might bounce back i.e. start appreciating from the demand level.
If a spinning top is formed at the supply level, then the probability of the future price movement bouncing back from the supply level increases because a spinning top at a resistance level means the bulls are losing their strength as they are not able to appreciate the price any further resulting into a huge possibility that the price might bounce back i.e. start declining from the supply level.
Example of a Spinning Tops Candlestick Pattern
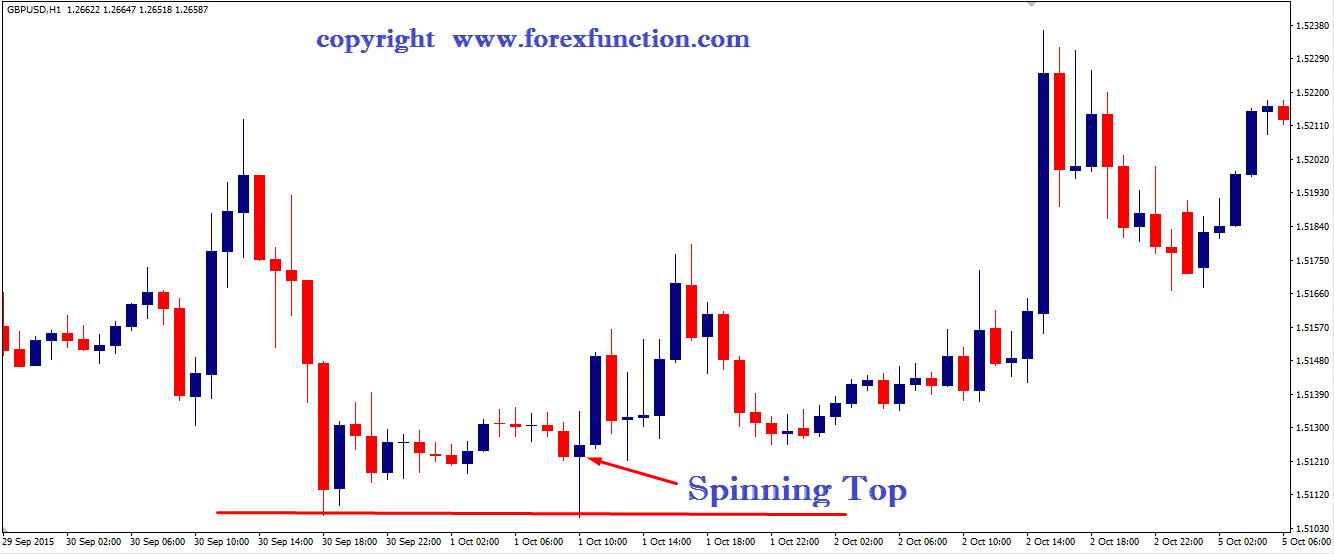
In the above GBPUSD, H1 chart, you will see that whenever a spinning top and/or tweezers are formed at the resistance and support levels, the probability of price bouncing back i.e. reversing from the demand and supply levels increases very highly.
3. Doji
Doji are extremely zero size skinny candlesticks i.e. they do not have any real body and/or the size of their real body is so slim that it almost appears like a straight line. A doji candlestick is formed after a fight more intense than a spinning top between the bulls and bears. In a spinning top, there is at least a small real body, but here in doji the real body is smaller than the spinning top or almost completely zero size.Doji’s are of 4 types and due to their zero size real body; they look like a Straight Horizontal Line, Plus, Cross and/or like an Inverted Cross Sign. The 4 different types of dojis are as following
4 Different Types of Doji Candlestick Patterns
A Doji candlestick is the result of an intense fight between the bulls and bears with nobody having the upper hand and finally resulting into a tie i.e. the zero size real body with the upper and lower shadow reflects the price action information that it was very active and volatile during the day, both bulls and bears had an intense fight for gaining the upper hand but despite all their efforts resulted into a tie by equally closing at the opening price and leaving the significant highest and lowest traded price action in the form of shadows.Doji’s play a very important role while analyzing the forex market because it is a key candlestick that gives us a cautionary signal for staying alert at the times of price action being traded at an extreme peak or trough price levels.
Doji Forex Trading Strategy after a Bullish Candlestick
If a doji is formed after the long bearish candles at a demand level, then the probability of the future price movement bouncing back from the demand level increases because a doji at a support level means the bears are exhausted and has lost their strength as they are not able to decline price any further resulting into a huge possibility that the price might bounce back i.e. start appreciating from the demand level.Doji Forex Trading Strategy after a Bearish Candlestick
If a doji is formed after the long bullish candles at a supply level, then the probability of the future price movement bouncing back from the supply level increases because a doji at a resistance level means the bulls are exhausted and has lost their strength as they are not able to appreciate the price any further resulting into a huge possibility that the price might bounce back i.e. start declining from the supply level.Example of a Doji Candlestick Pattern
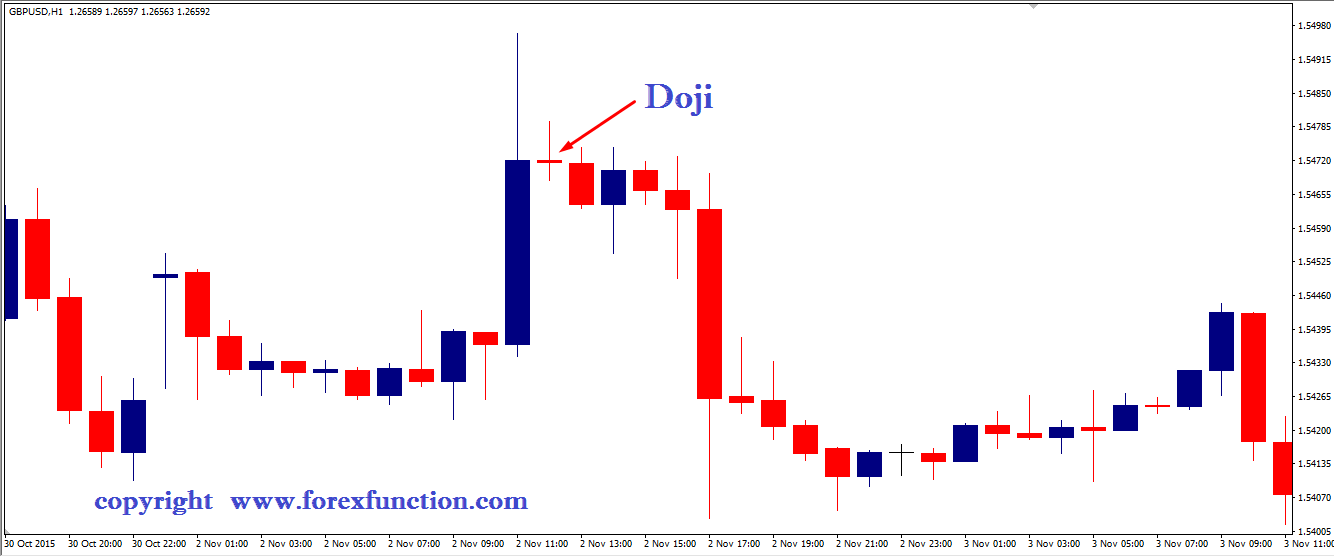
In the above GBPUSD, H1 chart, you will see a doji and also it has retested twice at a resistance level and after that the price started declining very beautifully from the resistance level without any difficulties, however, after 3 big bearish candlesticks, a spinning top was formed at the previous support level, but as there was still power left with the bears they pierced a little more in the demand level and finally after a doji was formed at the demand level, the price showed appreciation and not only the price advanced but even broke the resistance level, further price was retested by a couple of tweezers and continued to trend upwards.
Warning
Do not trade every candlestick pattern, when you see it at the chart. All Candlestick patterns should be used for trading in context i.e. any candlestick pattern, for example, if a doji is formed in the middle of a price swing, then it has to be ignored because it has formed in the middle, it might be a pause for getting refreshed because it is not at a demand level or a supply level, as a result, the probability is a very low for a reversal and the price might continue its original trend.Conclusion
Kindly remember, a single and all candlestick patterns are very useful and should be used as a tool for confirmation of a trade setup with your personal trading strategy. A single candlestick and all candlestick patterns provide the best possible probabilities for speculating the future price movement and also we are able to achieve miraculous rewards while trading forex if they are properly used in context i.e. if any single candlestick and/or all candlestick patterns is formed at a support and resistance levels; we get a double confirmation and hence we are able to profit from a low risk trading opportunity to reap huge profits.Submit Your Comments:
FOREX VPS FOR TRADERS
FF FOREX VPS
Windows 2012R2/2016 | Server Location Amsterdam, France, Canada | Low Latency From Brokers| Super Fast Trading Experience | All types of EA supported | 3 Days Money Back Guarantee
| Plan Name | Buy Link | CPU | RAM | Disk | BandWidth | Price (Montly) | Price (Quarterly) | Price (Semi-Annually ) | Price (Annually) | Installation | BackUp | Setup Fee |
| ECO-01 | buy now | 1 Core | 756MB | 18GB | Unmetered | $4.99/M | $4.49/M | $3.99/M | $2.99/M | MT4 Pre-Installed | Yes | Free |
| ECO-02 | buy now | 1 Core | 1GB | 22GB | Unmetered | $5.99/M | $5.49/M | $4.99/M | $3.99/M | MT4 Pre-Installed | Yes | Free |
| ECO-03 | buy now | 2 Core | 2GB | 30GB | Unmetered | $9.99/M | $9.49/M | $8.99/M | $7.99/M | MT4 Pre-Installed | Yes | Free |
| ECO-04 | buy now | 2 Core | 3GB | 32GB | Unmetered | $13.99/M | $13.49/M | $12.99/M | $11.99/M | MT4 Pre-Installed | Yes | Free |
| ECO-05 | buy now | 3 Core | 4GB | 40GB | Unmetered | $17.99/M | $17.49/M | $16.99/M | $15.99/M | MT4 Pre-Installed | Yes | Free |
| ECO-06 | buy now | 3 Core | 5GB | 45GB | Unmetered | $21.99/M | $21.49/M | $20.99/M | $19.99/M | MT4 Pre-Installed | Yes | Free |
***We accept Paypal, Perfect Money, Bitcoin !


